Overview
This project was conducted as the final project for CSCI 1951A – Data Science at Brown University during Spring 2025. In light of the massive labor market disruptions caused by the COVID-19 pandemic and the increasingly vocal online discourse around work and employment, we set out to explore how subjective experiences shared online corresponded with objective labor statistics.
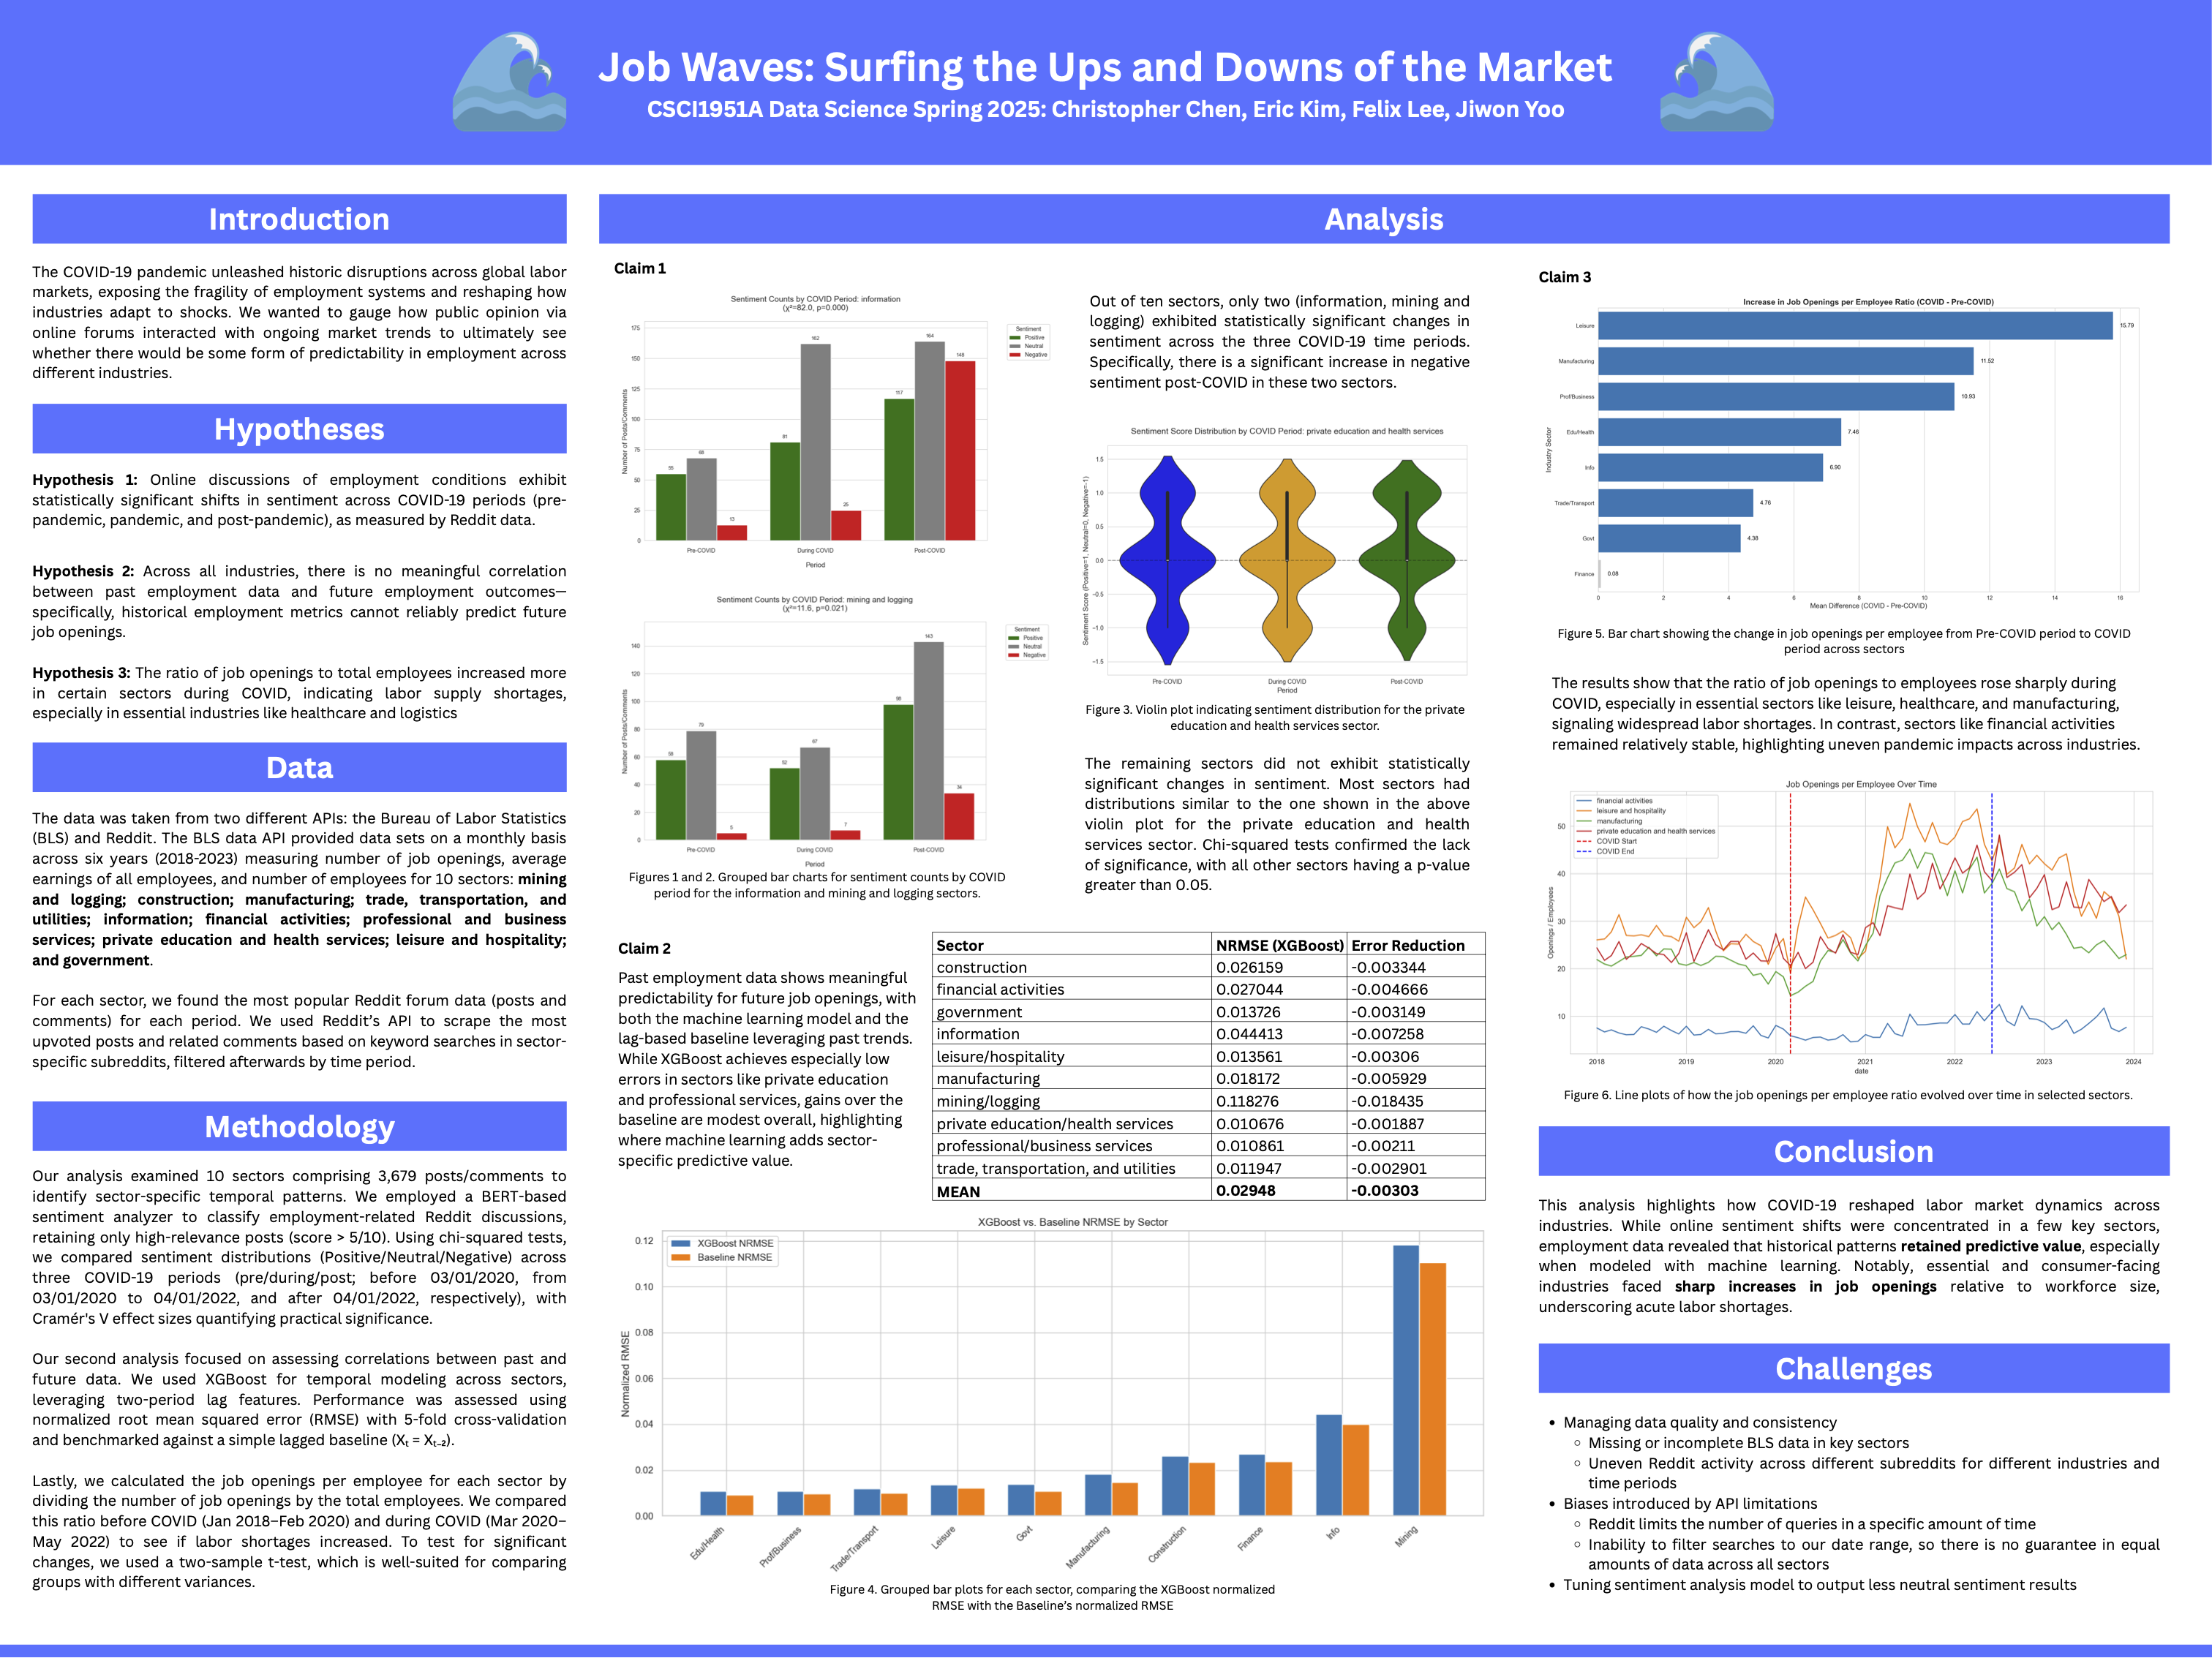
Our approach fused two data streams: quantitative labor market data from the U.S. Bureau of Labor Statistics (BLS), and qualitative sentiment data mined from Reddit discussions across various employment-related subreddits. We focused on ten industry sectors and gathered data spanning six years (2018–2023), combining machine learning, statistical testing, and natural language processing to identify trends and validate hypotheses.
By integrating structured and unstructured data, and pairing computational rigor with human-centered analysis, we sought to uncover not just what happened in the labor market, but how people felt about it.
Hypothesis Formation
We formulated three distinct but interrelated hypotheses to study different facets of labor market and sentiment interaction.
- Hypothesis 1: Online discussions of employment conditions exhibit statistically significant shifts in sentiment across COVID-19 periods (pre-pandemic, pandemic, and post-pandemic).
- Hypothesis 2: Historical employment metrics (e.g., job openings, employee counts) do not reliably predict future job openings across all industries.
- Hypothesis 3: The ratio of job openings to total employees increased more in certain sectors during COVID, indicating labor shortages, especially in essential industries.
These three presectives – public sentiment, predictive modeling, and labor market imbalance – allowed us to examine the impact of the pandemic from both social and economic angles.
Data Collection
BLS Labor Data
We gathered structured data from the BLS through its CES and JOLTS APIs. For each month from 2018 to 2023, we collected job openings, average hourly earnings, and total employment across ten industry sectors. These included the following sectors: Construction, Education and Health Services, Financial Activities, Information, Leisure and Hospitality, Manufacturing, Mining and Logging, Professional and Business Services, Trade, Transportation and Utilities, and Other Services. Initial attempts to use web scraping from individual BLS pages proved limiting, so we pivoted to API-based ingestion for improved structure and reliability.
Reddit Data
We queried Reddit’s API using PRAW and custom keyword mappings to pull posts and comments relevant to each industry. Each query was tailored to sector-specific language (e.g., "front desk", "software layoffs") and included results from popular subreddits like r/jobs, r/cscareerquestions, and r/nursing. We captured over 5,000 relevant data points, including timestamp, subreddit, and content.
We faced Reddit API rate limits and lack of time-based filters, which skewed the dataset toward recent years. To mitigate this, we broadened our keyword lists and filtered based on post relevance to ensure coverage across all time periods.
Data Cleaning & Merging
We implemented the entire cleaning and merging pipeline in Python, using pandas for data manipulation, json for Reddit data parsing, and numpy for feature engineering. The Reddit data was cleaned using a series of heuristics: entries with markdown formatting, emojis, URLs, or extremely short content were dropped. Each comment or post was then evaluated using a custom relevance score based on keyword matches and metadata (e.g., upvotes, length). We only kept entries with a relevance score of 0.5 or higher to ensure high-quality sentiment input.
To align the Reddit data temporally with BLS records, we bucketed each post by (sector, year, month). BLS data, pulled via an automated Python script using the requests library, was also cleaned, dropping rows with missing values in essential features such as job openings, average earnings, or employee count. This process was handled using null-checks and conditional filtering in pandas.
After cleaning, we performed a left join on both datasets using (sector, year, month) as the composite key. To support Hypothesis 2, we engineered lag features for all numeric BLS indicators using .shift(2) grouped by sector, effectively adding two-period lookback values that reflect temporal dependencies. The merged dataset was then exported to CSV and JSON formats for use in modeling and visualization scripts.
Data Analysis
Hypothesis 1
We used the transformers library in Python to apply a fine-tuned BERTweet model (finiteautomata/bertweet-base-sentiment-analysis) on the Reddit content. Sentiment predictions were further refined using TextBlob’s polarity score and a custom lexicon of employment-specific keywords, which we manually compiled after inspecting hundreds of Reddit posts. To counter the model’s tendency to over-label content as neutral, we adjusted the neutrality threshold (only classifying as neutral if the model confidence was low and polarity was within −0.01 to +0.01).
These adjustments revealed statistically meaningful shifts in sentiment across COVID periods. In sectors such as information, negative sentiment rose dramatically—from 22.86% pre-COVID to 56.92% post-COVID. This change paralleled real-world layoffs and hiring slowdowns in tech, providing external validation for our findings. Sentiment was aggregated by sector and time period using groupby operations in pandas, then visualized in grouped bar charts and violin plots.
Hypothesis 2
We trained an XGBRegressor from the xgboost library on the cleaned and lag-enhanced BLS dataset. Input features included lagged values of job openings, employee count, and average earnings. Using sklearn.model_selection.TimeSeriesSplit, we evaluated model performance with 5-fold cross-validation to preserve temporal order. We selected Normalized Root Mean Squared Error (NRMSE) as the primary evaluation metric, enabling comparison across sectors of different scales.
The model achieved an average test NRMSE of 0.02948, indicating strong predictability in sectors like healthcare and logistics. In contrast, performance declined in sectors like mining and information due to sparse or noisy data. We used xgboost.plot_importance to examine feature contributions: job openings emerged as the most influential feature, confirming its value as a leading indicator of labor demand.
Hypothesis 3
We tested for pandemic-induced labor shortages using the ratio of job openings to total employees. After filtering to include only pre-COVID (Jan 2018–Feb 2020) and COVID (Mar 2020–May 2022) periods, we conducted scipy.stats.ttest_ind (with equal_var=False for Welch’s t-test) to compare mean ratios. Prior to testing, we validated assumptions using the Shapiro-Wilk test for normality and Levene’s test for equal variance.
Our results showed statistically significant increases in the job opening ratio (p < 0.05) in nearly every sector. Effect sizes, measured using Cohen’s d, were highest in:
- Leisure and hospitality: d = 2.17
- Manufacturing: d = 1.64
- Business services: d = 1.73
These findings supported our hypothesis of labor shortages during the pandemic and aligned with real-world narratives about pressure on essential industries.
Visualization
We designed distinct visualizations tailored to each hypothesis.
Hypothesis 1 – Sentiment Analysis
For sentiment analysis, we used grouped bar charts to compare positive, negative, and neutral proportions across pandemic phases. Violin plots revealed the underlying sentiment score distributions, showing skewness and concentration across timeframes.
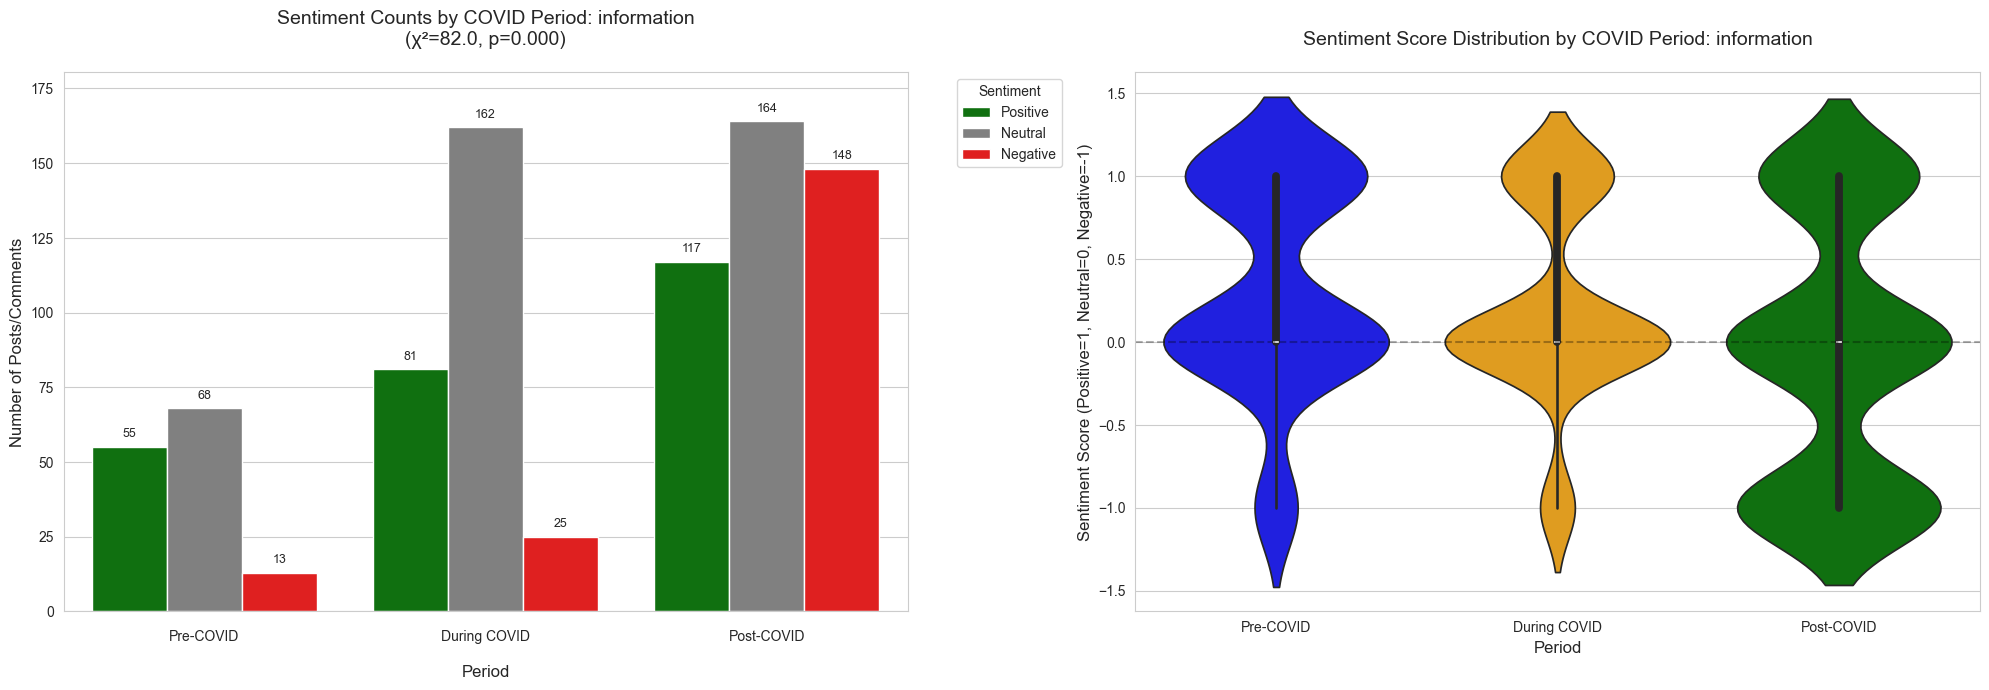
Left: Distribution of post sentiment across COVID phases (Information sector).
Right: Violin plot showing sentiment score density. Chi-squared test confirms statistically significant shift (p < 0.001).
Hypothesis 2 – Predictive Modeling
In our predictive modeling, histograms illustrated RMSE distribution across sectors, while grouped bar plots compared baseline vs. XGBoost performance side-by-side. Line charts tracked feature importance scores across folds and sectors, offering insights into model behavior.
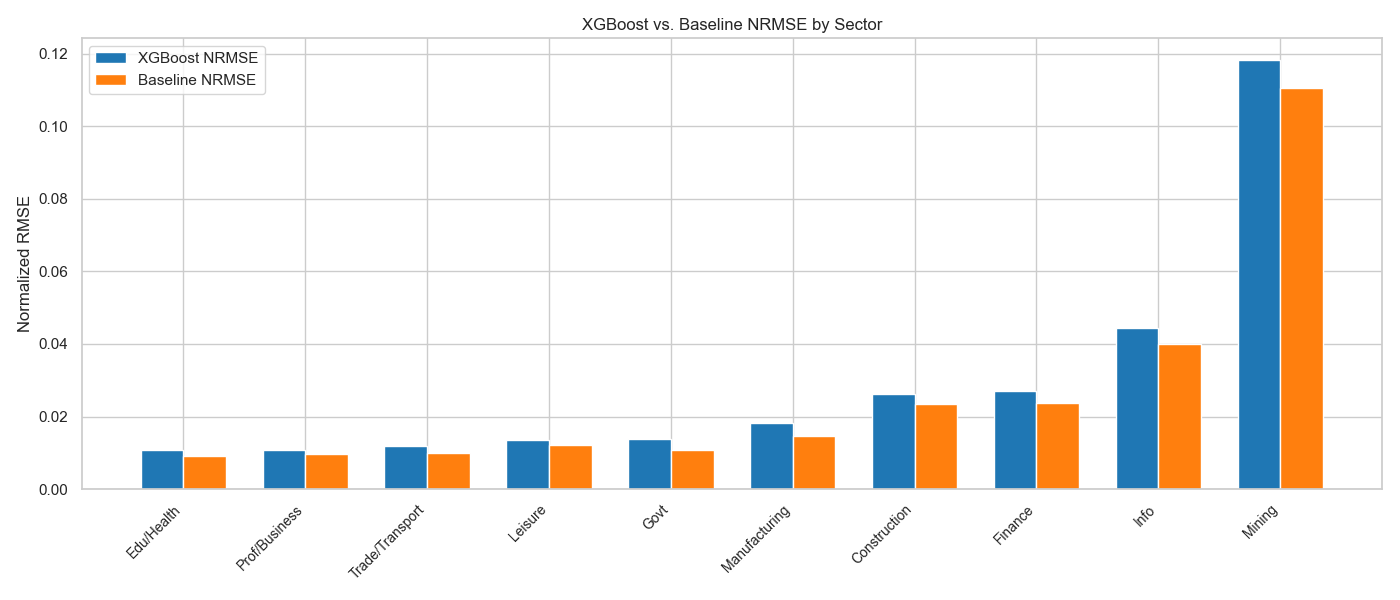
XGBoost vs Baseline: Most sectors show improved NRMSE over naive baselines, with better generalization in Education and Health sectors.
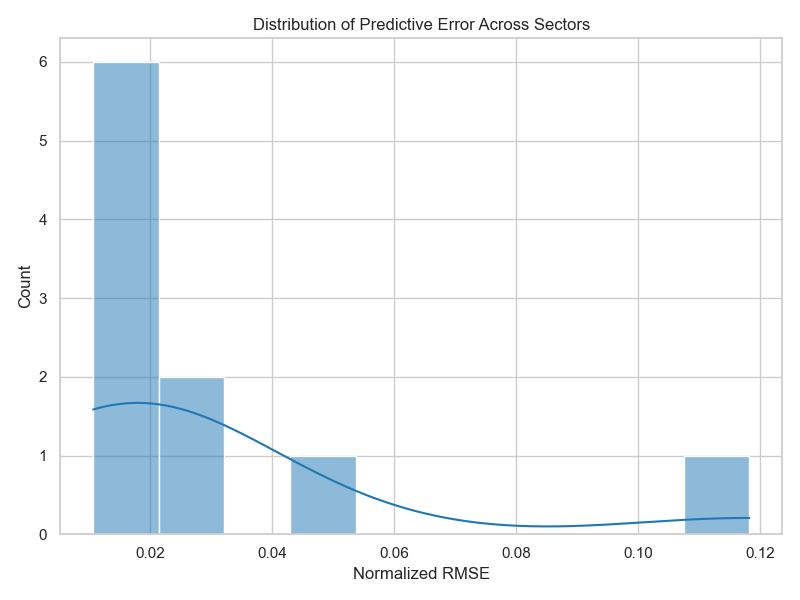
Error Spread: Histogram of NRMSE values across sectors indicates skew toward low error with few outliers in volatile industries.
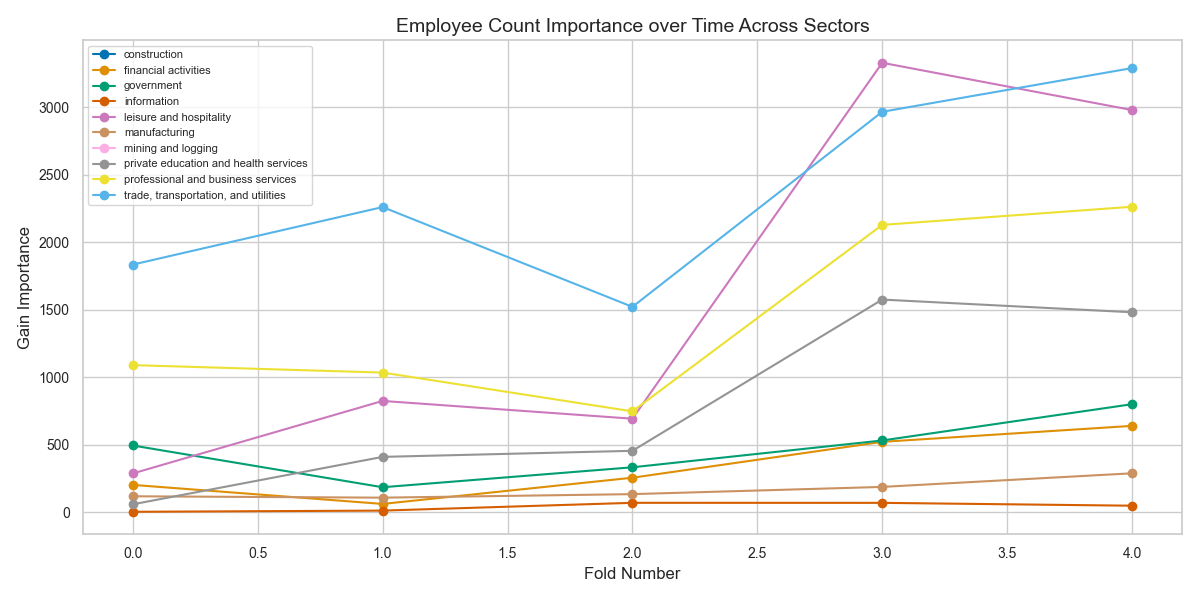
Feature Importance: Gain-based analysis of employee count across time. Trade/Transport and Manufacturing show rising influence in predictions.
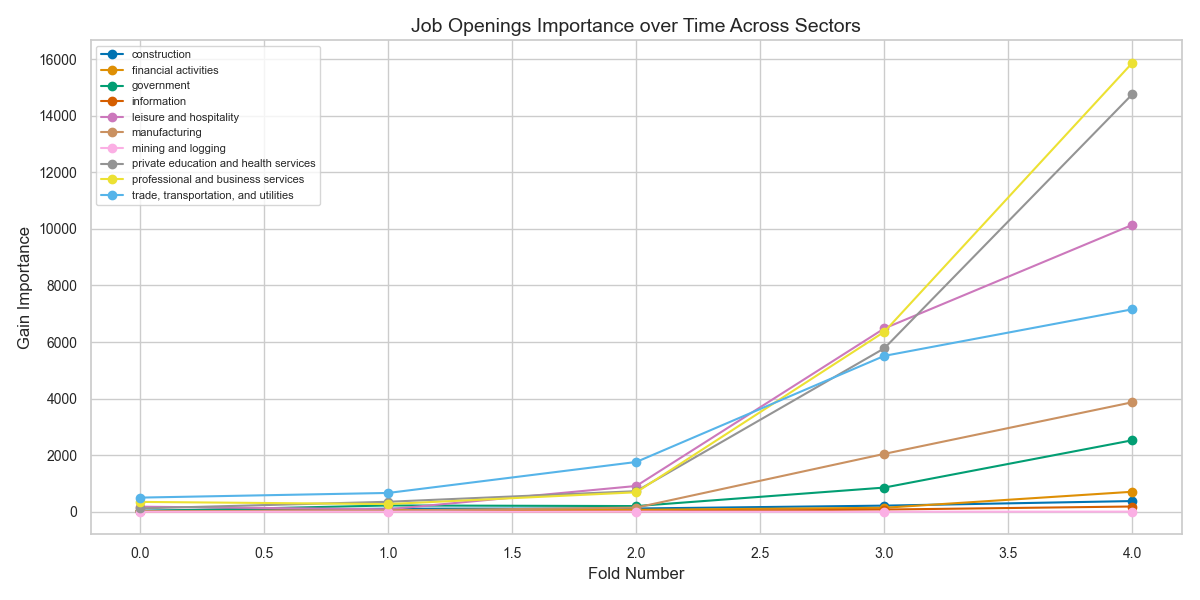
Temporal Shift: Importance of job openings increases markedly post-2020, suggesting change in predictive dynamics across folds.
Hypothesis 3 – Labor Shortage Analysis
For labor shortage analysis, we used horizontal bar charts to highlight magnitude of change, paired bar charts to show pre- vs. during-COVID values, and multi-line time series plots with dashed COVID boundary markers to track temporal shifts. Each chart was built with accessibility, interpretability, and stakeholder presentation in mind.
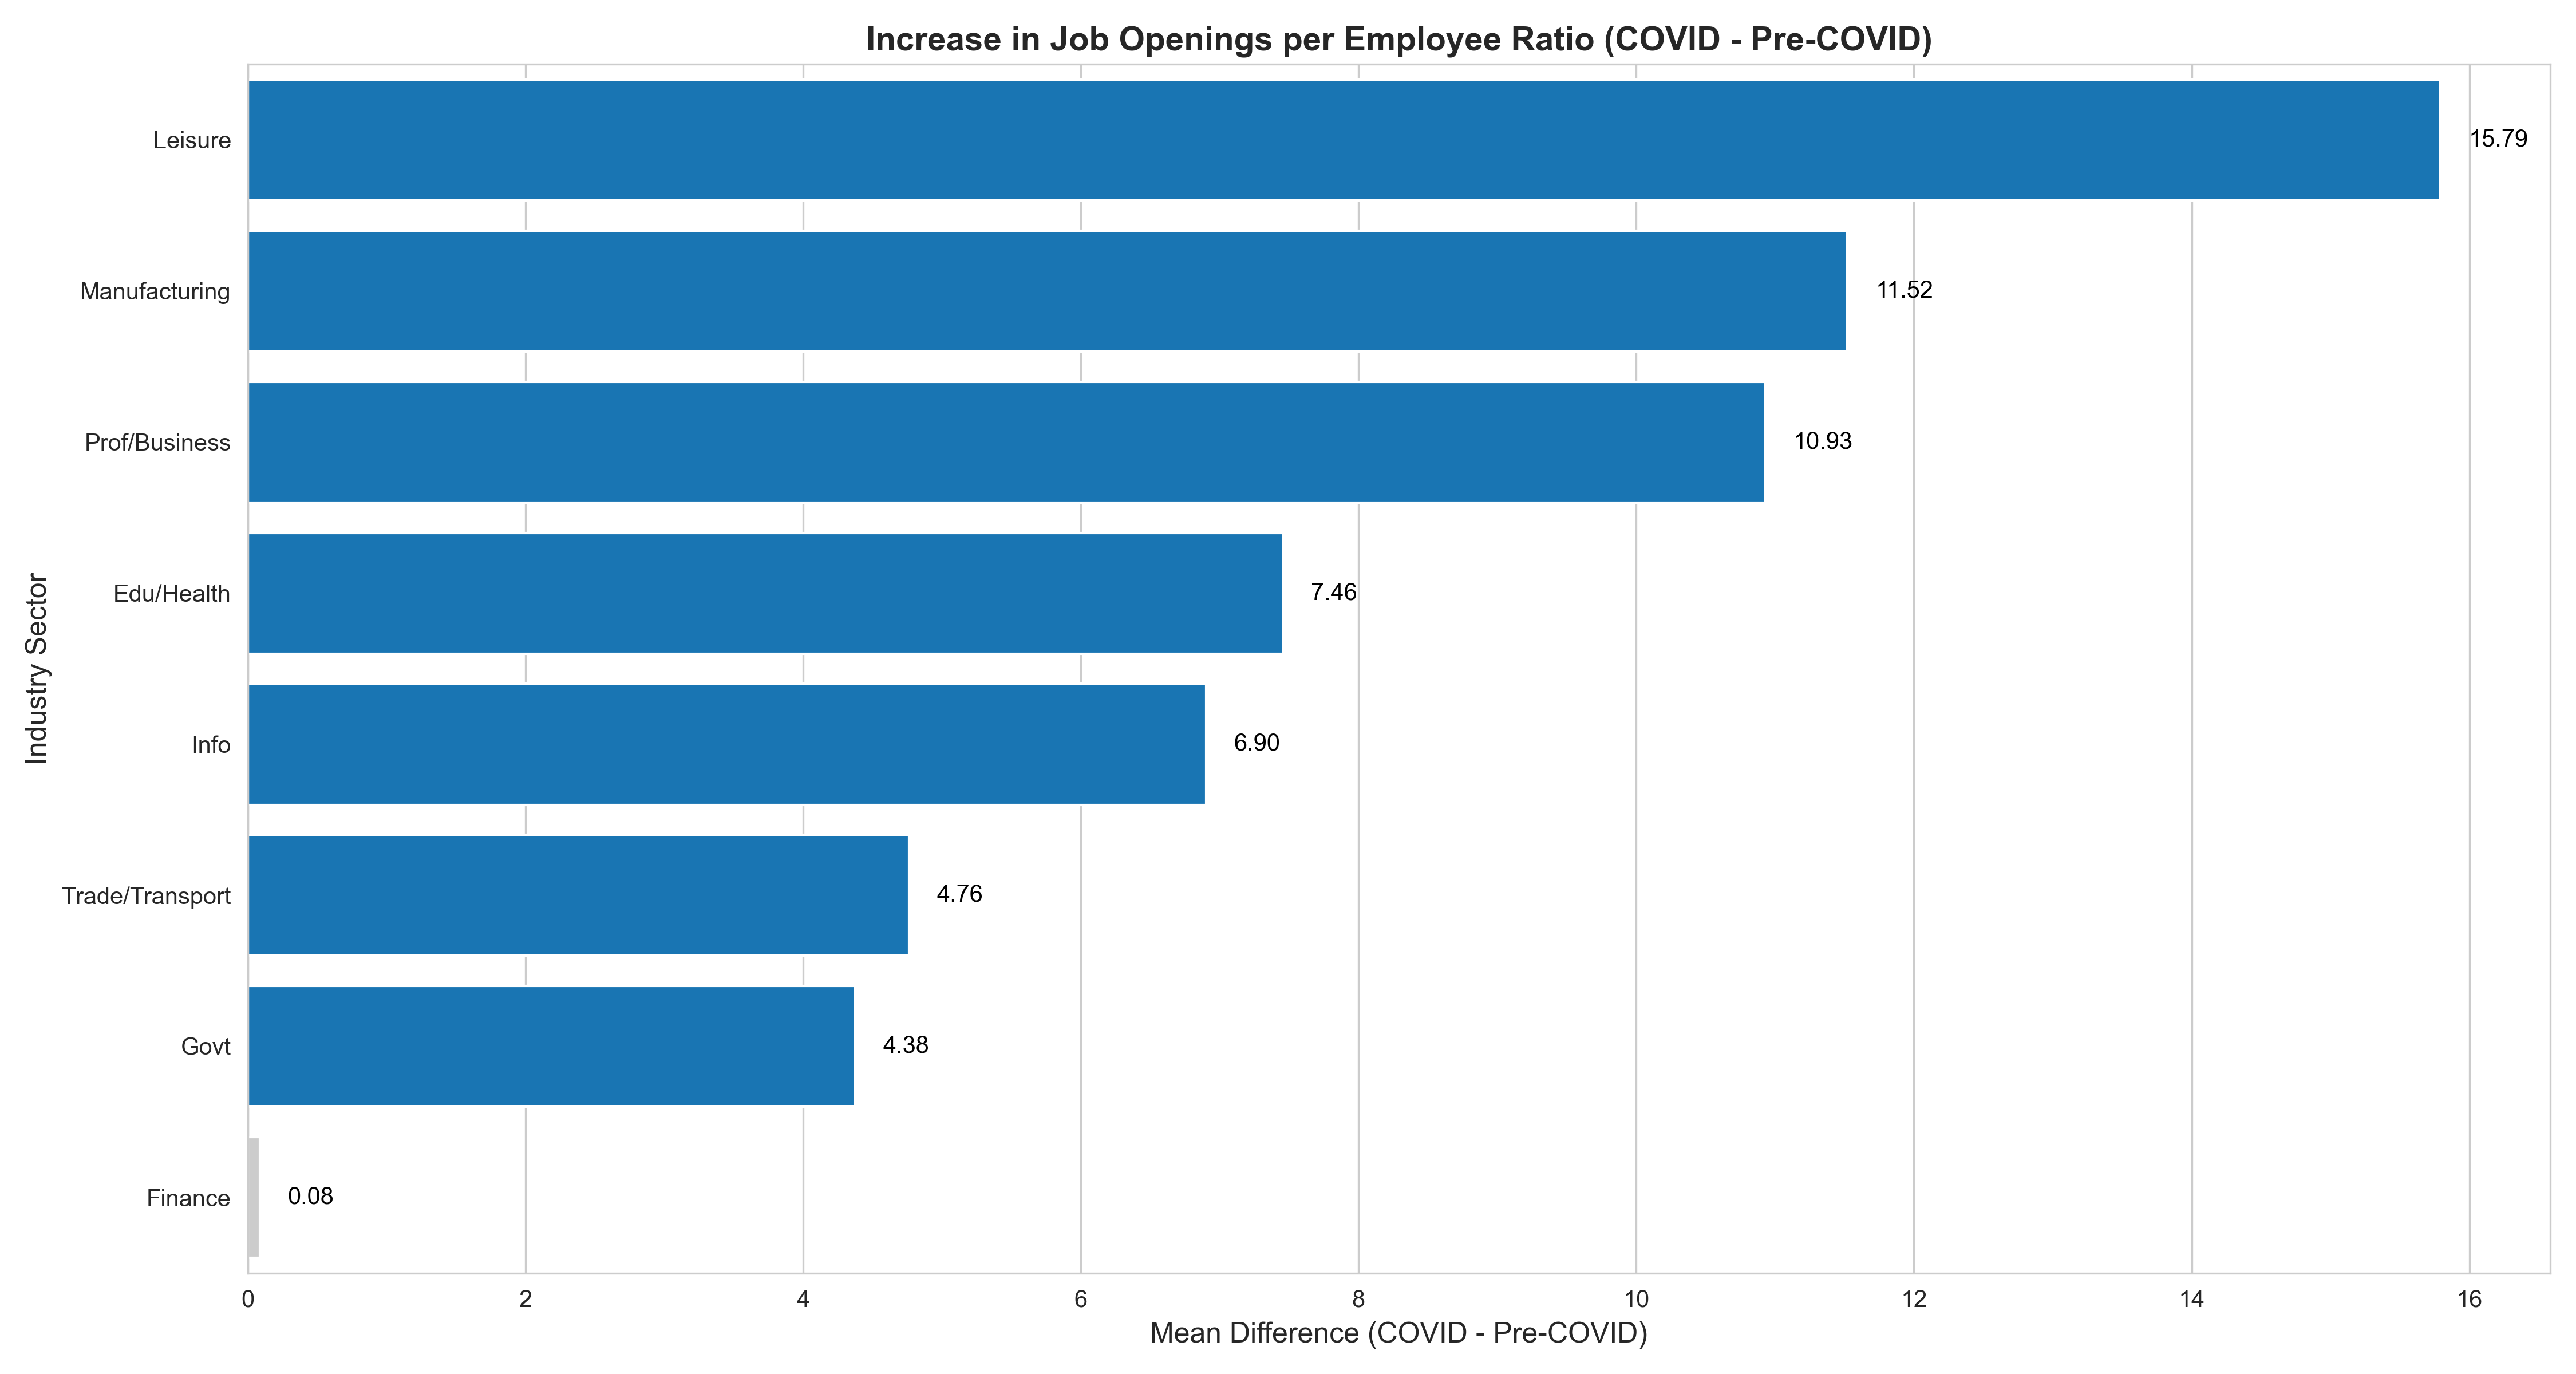
Magnitude of Change: Bar plot showing average increase in job openings per employee across sectors. Leisure sector leads with +15.8 openings.
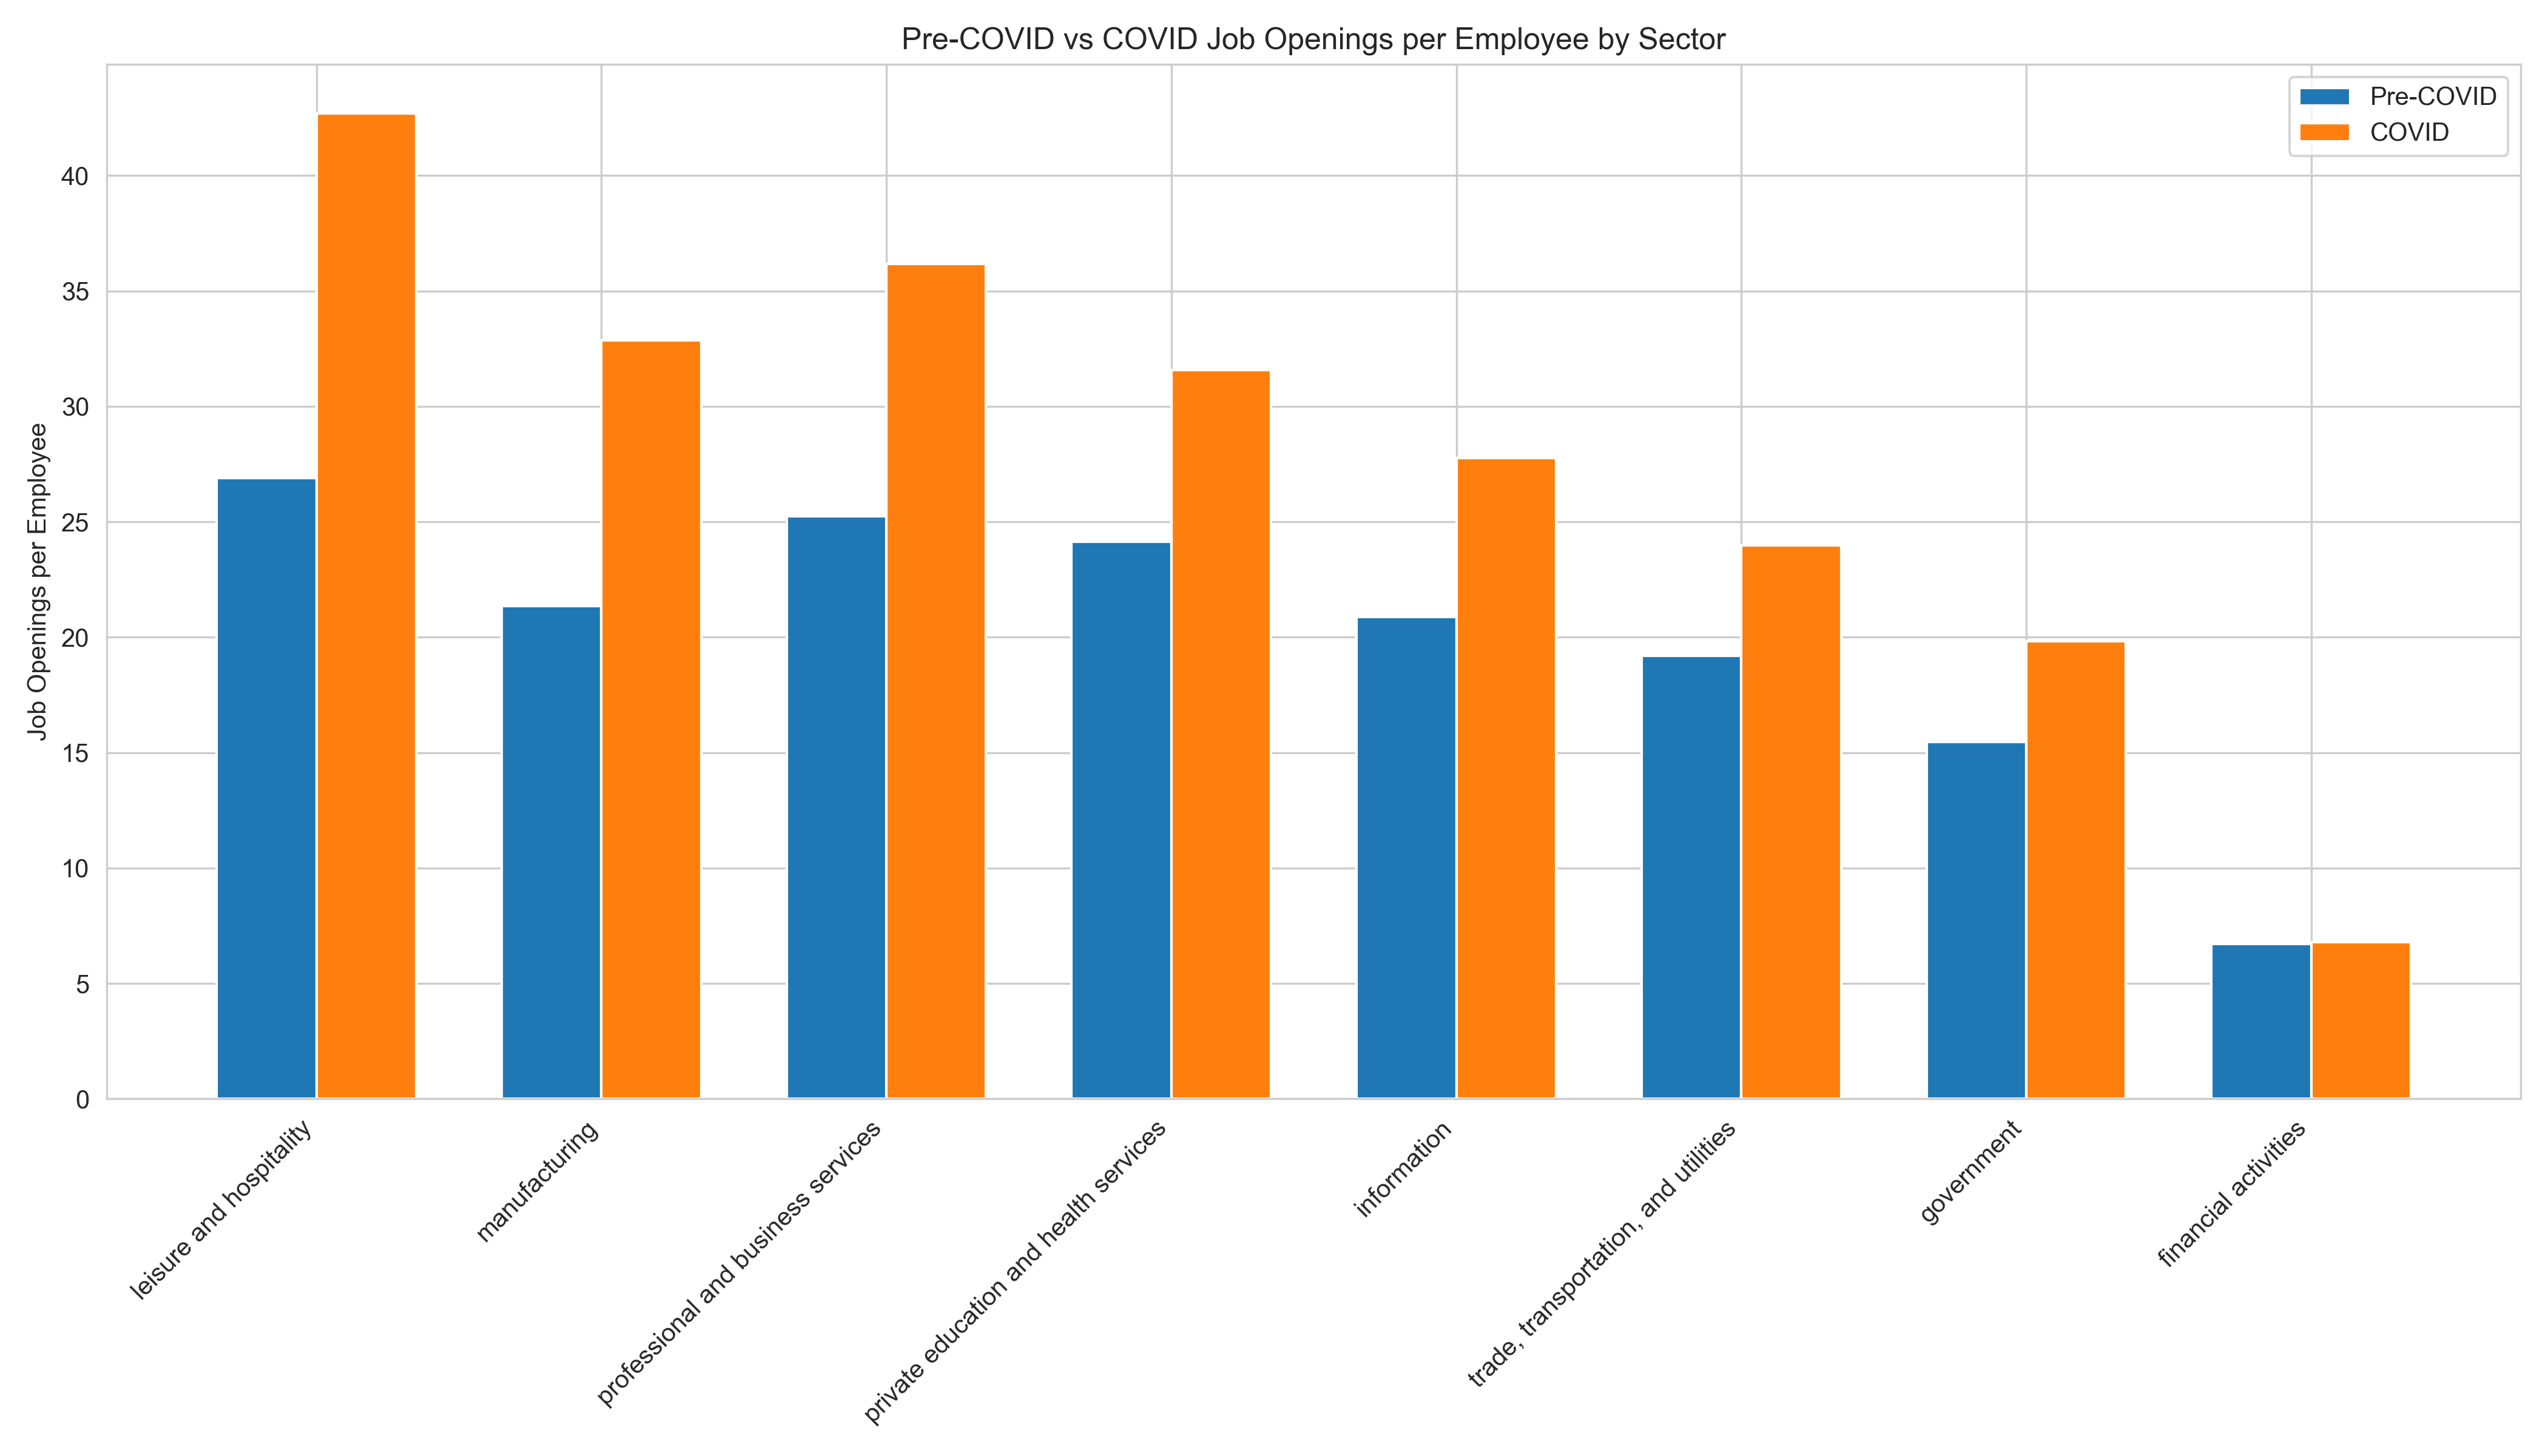
Before/After Comparison: Paired bars show absolute ratio shifts between Pre-COVID and COVID periods. Visualizes sectoral gaps at a glance.
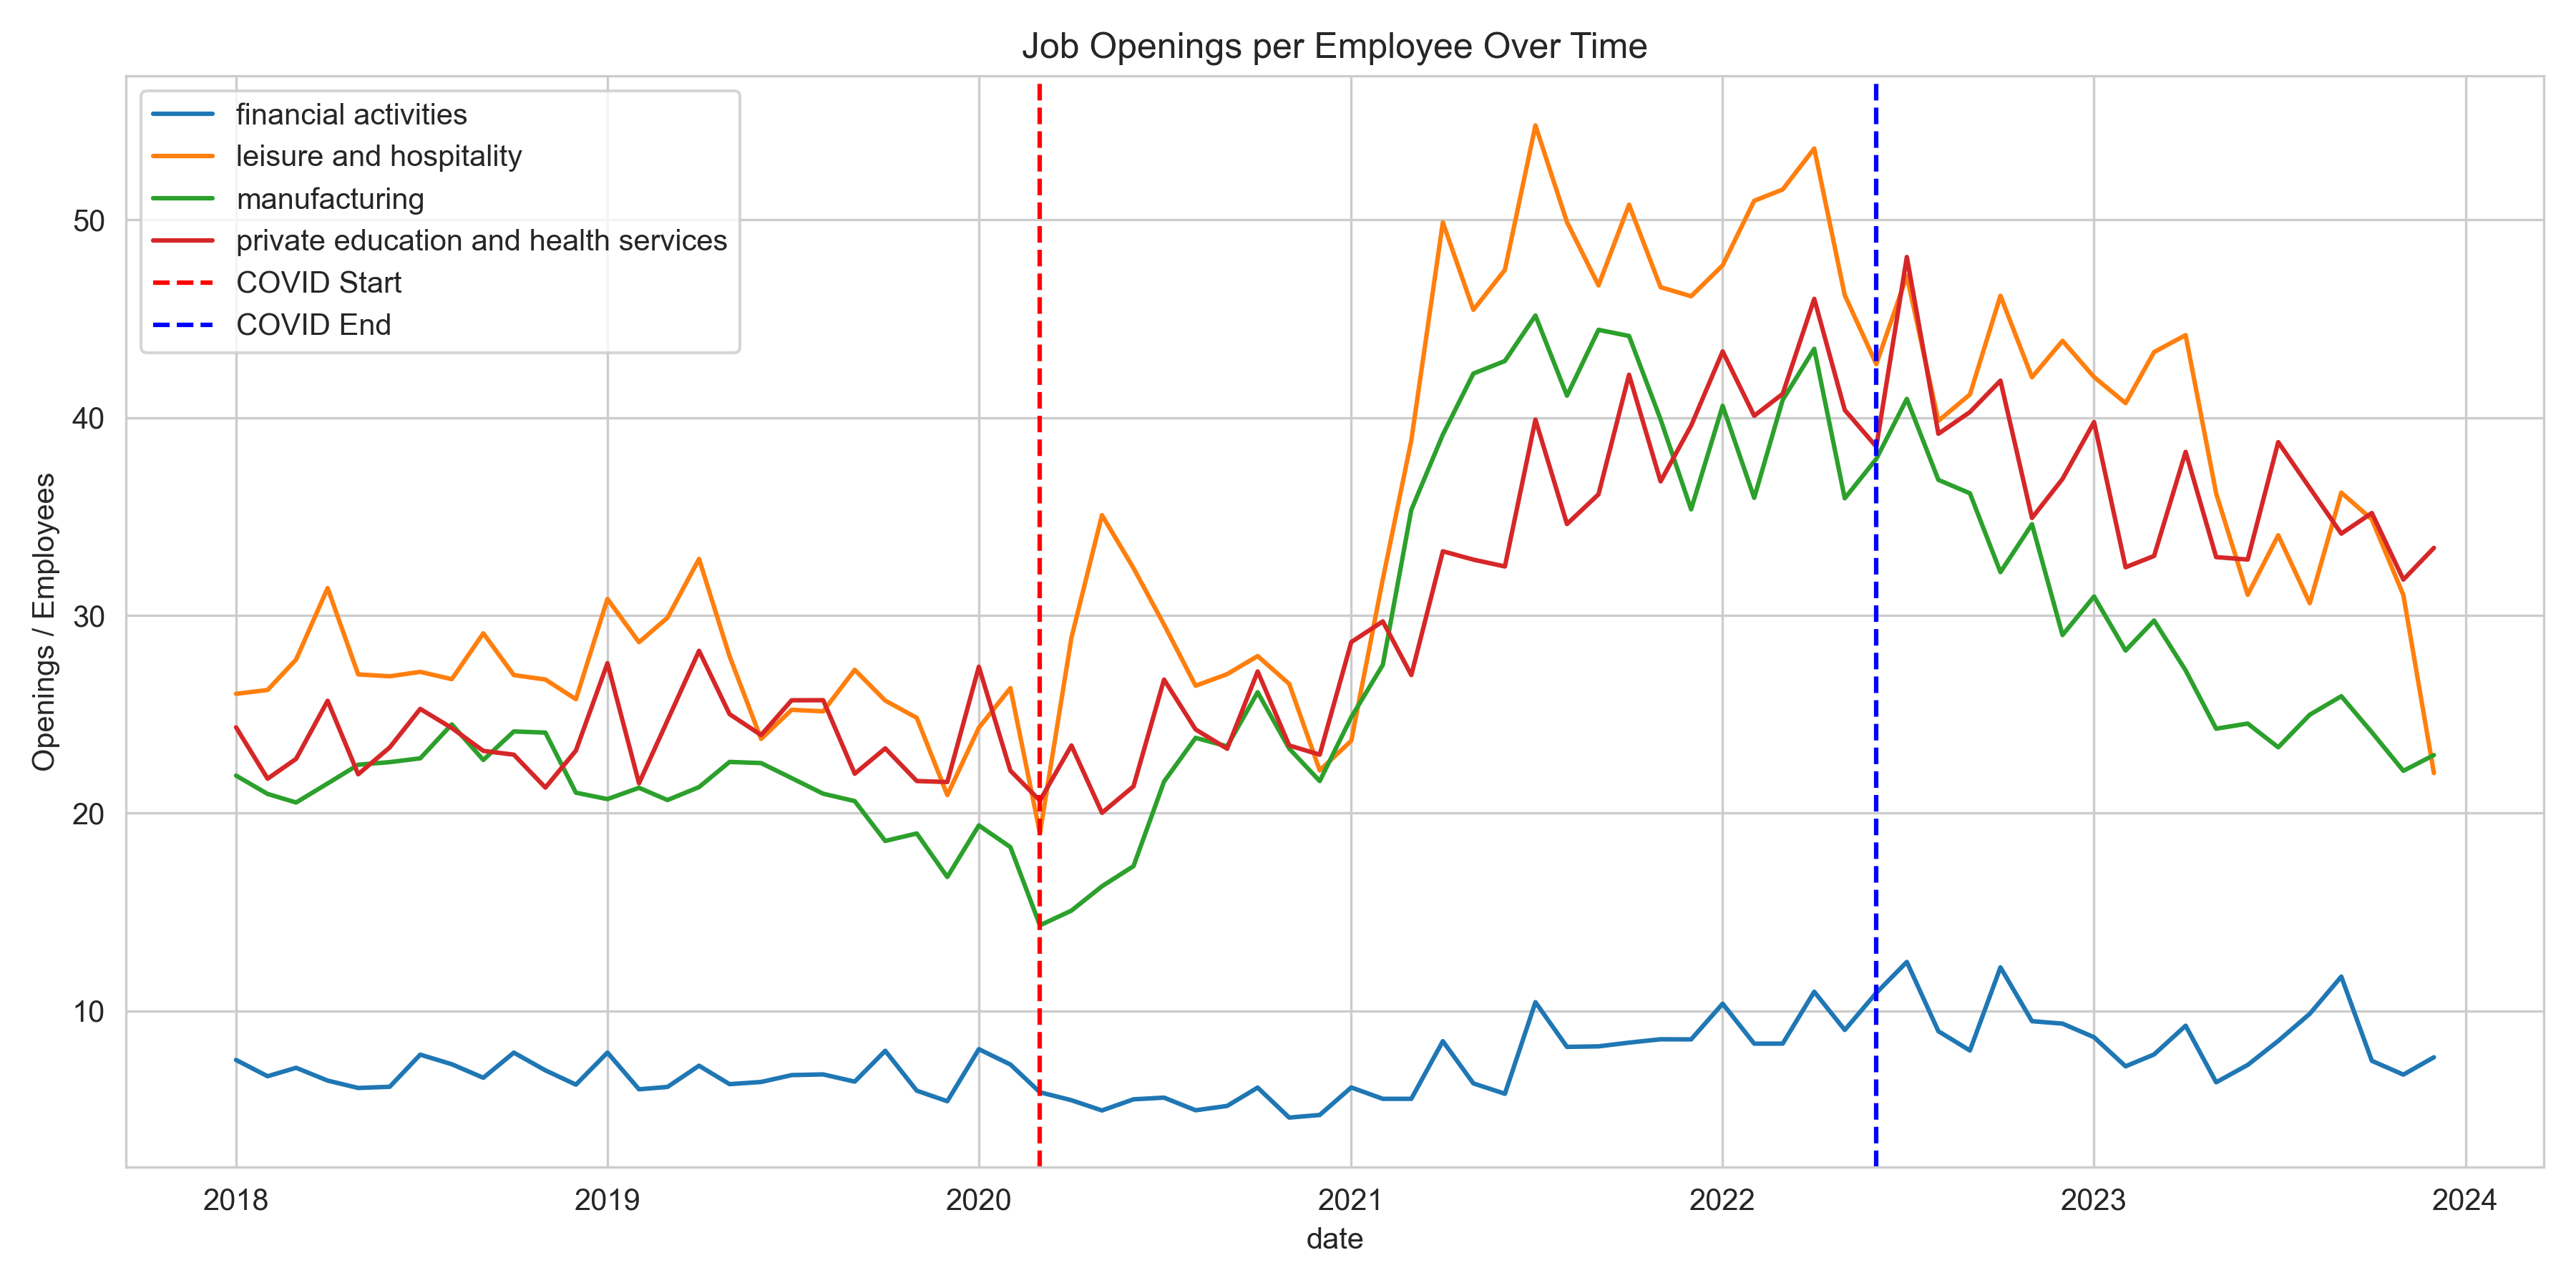
Time Series Trends: Tracked ratio changes over time in four representative sectors. Notable structural shifts begin Q2 2020 and remain elevated.
Final Poster & Github
This is the final poster we used to present this project.
Link to our github repo: link
Considerations
The study reflects a narrow demographic which introduces selection bias as Reddit users skew younger and tech-savvy. We maintained ethical data handling by avoiding PII storage and logging data source metadata. We acknowledge our analysis does not capture the full labor market spectrum, especially informal or underreported segments.
Next Steps
- Deploy a real-time version of the Reddit sentiment pipeline using the Reddit streaming API
- Expand sentiment sources beyond Reddit, incorporating Glassdoor, LinkedIn posts, or job board forums
- Introduce macroeconomic indicators (e.g., inflation, GDP) as additional features in our predictive models
- Test alternative time-series models like Facebook Prophet or LSTM neural networks
- Create an interactive dashboard visualizing live sentiment and labor statistics by industry
Reflection
This project brought together one of the most interdisciplinary blends I’ve worked on: spanning natural language processing, statistical modeling, economic analysis, and data visualization. As a semester-long project, it challenged us to think across technical boundaries while making high-impact design decisions at every step of the pipeline.
One of the most formative takeaways was understanding how complex and unstructured real-world data can be. Our initial plan to extract Reddit data by date quickly fell apart due to API limitations, forcing us to pivot toward a keyword-based scraping approach. This shift demanded creative problem-solving: we had to craft scoring heuristics to filter irrelevant content and build reliable indicators of post relevance. That iterative flexibility became central to the project’s success.
From a modeling perspective, we learned that powerful tools like XGBoost don’t always outperform simple baselines. In some sectors, the model delivered strong results; in others, data sparsity and volatility made predictive accuracy elusive. This experience reinforced the importance of context-driven model evaluation and helped us better assess when complexity is justified. Similarly, in testing for labor shortages, we saw the value of statistical rigor—running Welch’s t-tests only after confirming assumptions through normality and variance checks. These practices made our insights both technically sound and defensible.
Equally important was staying grounded in strategic and user-centered thinking. Rather than analyzing metrics in isolation, we framed our hypotheses around broader questions: How did workers feel? Could we detect stress points in the labor force? What patterns aligned with lived experiences? This mindset helped us interpret results with empathy and translate findings into meaningful narratives about workforce dynamics.
Ultimately, this project reminded us that data science is not just about extracting insights, but it’s about asking the right questions. Whether forecasting job openings or capturing sentiment in online communities, we learned to approach problems with analytical rigor, flexibility, and a focus on real-world relevance. That balance between computation and context is something I hope to carry into every project going forward.